 Techosta Where Tech Starts From
 The five largest stocks in the US equity market are now technology stocks, and together they make up more than $2.75 trillion in market cap (While Amazon’s (NASDAQ:AMZN) official sector categorization is Consumer Discretionary, we consider it tech first and foremost).
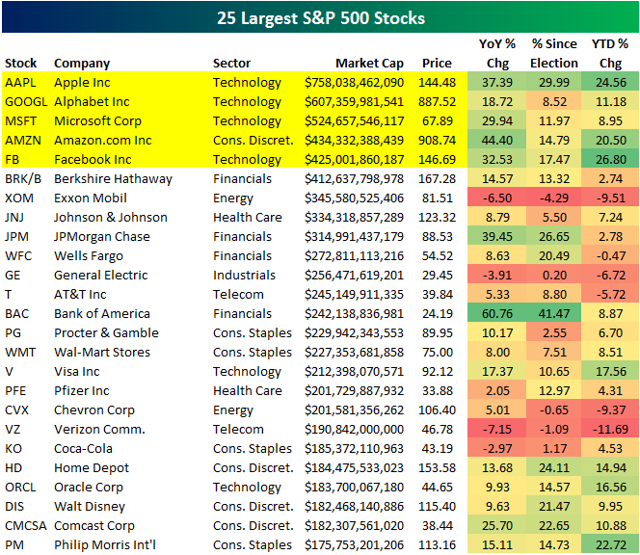
Below is a list of the 25 largest S&P 500 stocks (through 4/25/17). The top five are highlighted in yellow – Apple (NASDAQ:AAPL), Alphabet (NASDAQ:GOOG) (NASDAQ:GOOGL), Microsoft (NASDAQ:MSFT), Amazon.com (AMZN), and Facebook (NASDAQ:FB). It wasn’t long ago that Exxon Mobil (NYSE:XOM) was the largest stock in the world, and prior to that, it was General Electric (NYSE:GE). Now XOM ranks seventh and GE ranks 11th. Brick-and-mortar behemoth Wal-Mart (NYSE:WMT) also used to rank in the top three, but it has slipped all the way down to 15th with a market cap that’s just over half the size of online competitor Amazon.com.
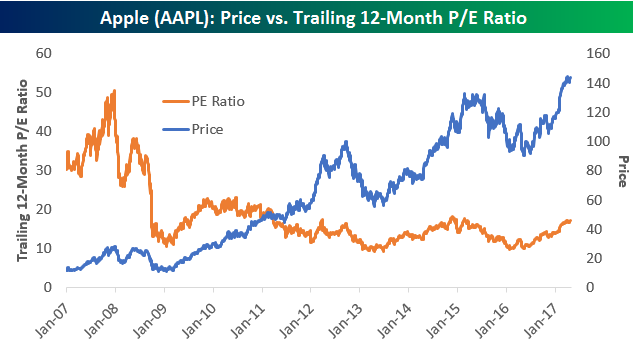
We thought we’d take a look at historical valuations for the five largest stocks in the S&P 500 using trailing 12-month P/E ratios.
As shown below, Apple used to trade much more like a “growth” stock prior to the Financial Crisis. During the current bull market, though, Apple’s average P/E has been 15 – which is more in line with where a value stock trades. At 17.25x trailing 12-month earnings at the moment, Apple’s valuation is above its bull market average but not excessively so.
Alphabet’s (formerly Google) earnings have been growing nicely since the start of 2016, as its P/E is down even though its price is up sharply. Alphabet’s average trailing 12-month P/E over the last 10 years has been 28.83, and its P/E right now is just above that at 31.4.
[“Source-seekingalpha”]